Showing posts with label Statistics. Show all posts

Wednesday, May 25, 2016

Kantian Origins Of Peircean Frequentism

Immanuel Kant

Charles Sanders Peirce was an early "evolutionary" philosopher. He believed that while our knowledge was now imperfect, correct science would - as a whole - learn to reduce those imperfections. He was a serious student of German Idealism (famously, he studied philosophy by reading one page of Critique of Pure Reason a day). He also helped found statistics, experimental psychology, modern logic and much else. Today, I want to look into how his interest in philosophy and statistics cross-bred.
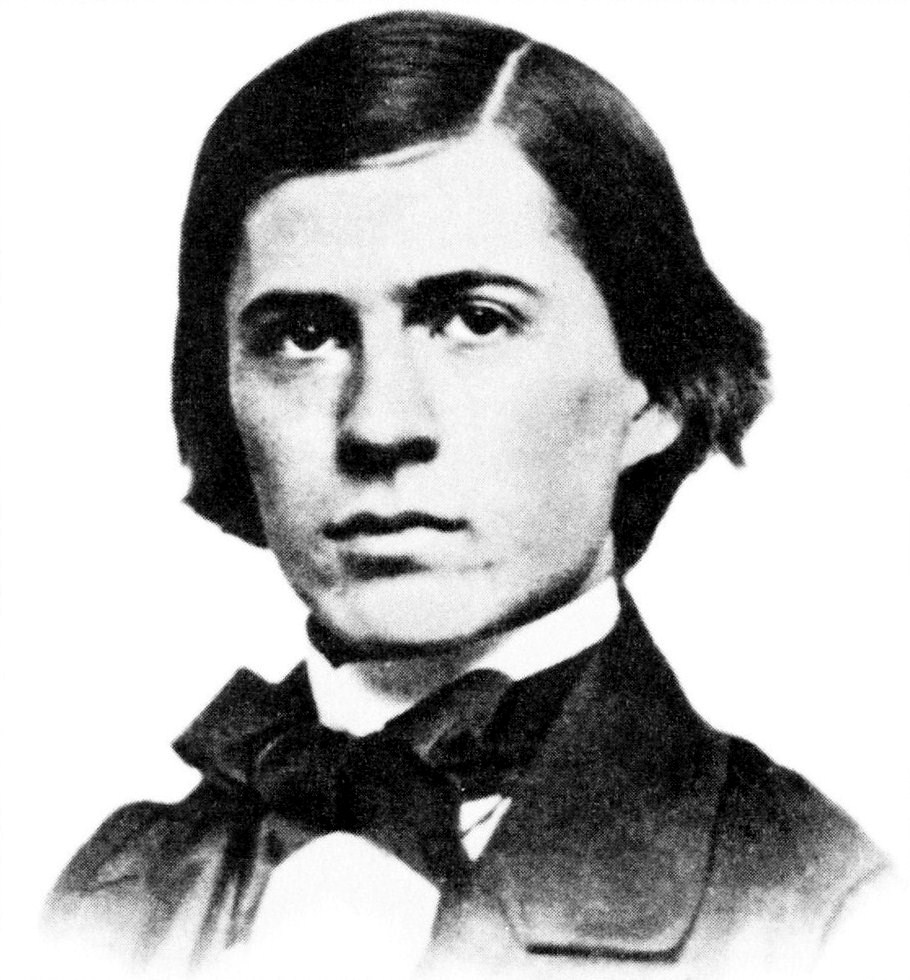
CS Peirce

How much of an evolutionary philosopher was Peirce? He went so far as to define "truth" as the outcome of an ideal scientific process. For instance, imagine we didn't know Peirce's first name. We could look it up in a book, you say. That's the best scientific practice, therefore that's the truth. Let's be more extreme. Say that, for some reason, direct records of his first name had been lost. At first we would only know that his name is in a certain set. By our knowledge of human language we know that his name isn't "Hmxfrzt". By historical considerations we can eliminate "Cao Pei" and "Christina". Through long search and careful philological textual criticism, eventually we figure out it was probably "Charles". Therefore, it is true that Peirce's first name was "Charles".

This is eccentric because we normally think of "Charles" as being Peirce's first name because of actions done in the past (namely, his being named by his father), not because it is an outcome of actions of philologists of the future. This definition will even have an important effect in his statistical prescriptions.

Peirce's definition didn't come out of thin air. To recapitulate: On the one hand, he was an experimental scientist inspired by his work in physics, psychology, etc. On the other hand, he was a serious Kant-inspired philosopher. In particular, Kant's image of the sensible world of experience and the unknowable world of things-in-themselves was an inspiration to Peirce as a statistician. The world we can see, hear, smell, taste & feel is called the "phenomenal world" (as in, it's where phenomena occur), the deeper underlying world is called the "noumenal world" (we'll get to why in the next paragraph).

How do we gain knowledge of the noumenal world? Remember that this is the old days, before some young Germans questioned Newton & Euclid. So most people believed we did have knowledge of the underlying world-in-itself. Kant did not. Kant believed that the phenomenal world was basically psychological and sociological. Human beings evolved to perceive the abstract world-in-itself in Newtonian/Euclidean ways, he thought. We - our society - adopted conventions constrained by those evolved capacities. This mode of thought was further developed by Schopenhauer and I've covered it on this blog before.

Peirce (and, earlier, Hegel) disagreed with Kant. They hoped that perception of the things-in-themselves would turn out to be solid and objective rather than subjective and biological. Hegel defined truth as the outcome of a long social process - one which, unfortunately, only existed in his mind. Peirce defined, as we saw above, as the outcome of a convergent scientific process - processes that he then went out and tried to do.

In Peirce's theory, the real world-in-itself is a set of interacting (possibly/often non-measurable) facts and relations between these facts. These facts can be constants, such as the 19 parameters of the Standard Model, or they can be variables, such as the total population of a country or temperature. These facts can be basic, like energy, or "emergent", like temperature. That underlying world could only be approximated sadly phenomenal studies. Therefore, even crafty experiments surrounded the true values (of, say, the fine structure constant) with error bars. Pierce called these error bars the "probable error", today we call the equivalent notion "confidence interval". Peirce's work is, in many ways, the beginning of statistics.

Peirce first developed his statistical ideas when studying the experimental errors of using pendulums to study the acceleration due to gravity, but it is equally valid to consider coin-flips. The facts of a given sequence of coin-flips are statistically related to the underlying reality of governing the coin. In the case of coin-flips, we can appeal to Bernoulli's theorem to prove that the scientific best practice leads to The Truth, the coin-in-itself.

This is a mathematical version of the general example I gave above, when we learned Peirce's first name. You then might again notice that Peirce's definition of truth is eccentric. Mathematically, one must posit a true value and prove convergence toward it. I think Peirce would reply that this is a mathematical convenience and the truth was the reverse, a coin is known as fair from the throwing. Peirce developed this definition in scientifically relevant ways. For instance, he would say that Bayesian methods are not scientifically relevant unless paired with a robust convergence proof. One can construct instances in which a Bayesian procedure does not converge. From Peirce's point of view, this would mean that for such agents, the truth is meaningless.

So we see how philosophy affected statistics. Peirce's forward looking definition of truth ruled out Bayesianism, his love of Kant made Frequentism attractive. Notice that these are logically quite separate!

All this would have been by itself interesting, but Peirce actually went further. He gave a specific quantitative guide to such reason in his "Note on the Theory of Economy of Research". The essence of Peirce's reasoning is here. Peirce's discovery is even more remarkable because not only did he notice the parallel with the ratio of marginal utility - he also did so in 1879, making him the among the first important American Marginal theorists of any kind!

Given the importance of Marginalism in his thought, one should not be surprised when he says: "The truth is a kind of efficiency.". Surely someone who could say that can be called a pragmatist.

Though Peirce had a chance to become one of the great economists of his time, he didn't take it up. In addition to the above, he was also the first to state the axiom of transitivity of preferences (he had to be - he also invented relational algebra). Interestingly for the proto-frequentist, he was also the first to measure systemically subjective probabilities and among the first to rigorously define probability in terms of economic decisions. Unfortunately, he rarely took the time to find deeper implications of his economic thoughts (the above being the only exception to this rule). Certainly, his rival Simon Newcomb (interestingly, the rivalry, while well-attested, was unknown to Peirce...) would not have appreciated it.

Karl Marx

All that brings me to the next 19th century philosopher/economist to explain: Karl Marx.

Wednesday, July 23, 2014

Are Non-Parametric Methods Simpler To Teach Than Parametric Ones?

There is an adage that any title that ends in a question mark can be answered "No.". However, this proposal might have some weight. I have seen students take an entire course in statistics and not be able to identify what a statistic even is, which is almost a crime. Some of the blame comes from disinterested students cramming to fill a requirement, but part of the problem is how statistics is taught. Students are not taught to see what a statistic is in its natural environment. In fact, with automated statistics programs, it would be much easier to teach non-parametric and data driven statistics first, then teach parametric statistics with regression analysis in a second course. Instead, it's instantly on to z-scores and t-scores as if just because Fisher found them first they must be the easiest!

But simplest in theory is not simplest to learn. A better method would be to emphasize probability distributions, data driven methods and non-parametric tests and using statistical software (in a stats for life, non-calculus based statistics course especially!). These are more complex theorems, but I'm talking about classes in which central limit theorem isn't proven in the current system anyway. If you aren't proving the theorems anyway it doesn't matter how difficult it is to prove them. Anyway, the most important fact in statistics - what makes statistics work at all - is that gathered data can be used to generate a probability distribution. Everything that we learn from the statistics are facts about this distribution. Again, this is not emphasized in stats for life classes, and I don't know why. In my opinion, an entire section of the course, perhaps a month, should be spent on taking data and looking at a distribution, a pdf and a cdf curve. The student should learn what a statistic is by relating them to the geometric pictures they are getting from gathered or generated data. For instance, the measures of center (means, medians, modes) should be related to the actually observed centers in data. This is supplemented with the use of statistical software - perhaps R for advanced students, Excel for less advanced students - to show how statistics are found in practice. Once the students understand that a statistic is a function of a distribution, then we can move on to tests. Several non-parametric tests, such as the Kolmogorov-Smirnov Test and cdf-based nonparametric confidence intervals are easily related to the geometry of the distributions and easily coded. This experience will teach them the students the point and practice of statistical tests more than z-scores as they are currently taught, because the way z-scores are currently taught relates them to a distribution that doesn't obviously come out of data. The students are unused to thinking about data as a distribution because they are taught that only a few distributions and only given the CLM as a heavenly cheat that means that we don't have to think about how large sets of data will be distributed to estimate the mean (which even by itself is not language they are used to!). Obviously the normal distribution frequently comes out of data asymptotically, but I've found that the students find this too many hurdles to leap at once. If we give up that useful fact and concentrate on teaching the basics - distributions, statistics and statistical tests - it will seem less magical to the students.

A personal note: I remember the first time I taught statistics the same reason that I remember the first time I drove a car that caught fire - the nightmares. However, the students did react to some things well. I had them run a roulette simulation in excel, to show that asymptotically they would lose money. Seeing the data and the trends helped them immensely, they learned a lot and enjoyed it. In retrospect, I realize I could have taught much more like this. In fact, everyone can. I could have had them make a kernel of the roulette outcomes, so that they would realize it is a pdf. I could have had them find the statistics of that distribution, or run a regression and relate the regression to the statistics. All opportunities wasted.

To summarize:
1. Statistics stands on three pillars.
2. The first pillar is that data induces a probability distribution.
2a. But in current statistical teaching practice, students are not drilled into instantly putting data into a probability distribution. Since this can be done easily with technology, they should be.
2b. This means that even though non-parametric statistics is in general harder for statisticians, this doesn't mean it is to learn for students. After all, we can control the data they use so that they see mostly well behaved data in homework.
3. The second pillar is that certain functions of those empirical distributions capture the facts about the distribution that we care about. These functions are called statistics.
3a. But in current statistical teaching practice, statistics are introduced piecemeal (even then, only the measures of center and the variance) and poorly connected to probability distributions. Once a student is used to creating probability distributions from data in the previous step, computing functionals of the distributions is easy. For instance "find the max" is equivalent to computing a mode, "find the center of gravity" is equivalent to finding the mean and "find the middle" is equivalent to finding the median.
3b. This assignment is an extension of the above - "given data draw the empirical distribution" was the previous one, this one is "given data draw the empirical distribution, print it out and make marks on certain spots" is this one. This can be supplemented with using technology to find these automatically.
4. The final pillar of statistics is statistical testing, do the statistics of the data say what we want?
4a. But in current statistical practice, statistical testing is introduced mainly in a specific case, z and t scores. This means that statistical testing is presented piecemeal, with only a few sentences said for justification. To understand this choice, one must understand the central limit theorem. Answering these questions requires the teacher to hand a distribution to you, which detaches the student from the process of going from data to geometry to conclusion.
4b. This assignment is an extension of the above - "given data draw the empirical distribution, print it out and make marks on certain spots" was the previous one, this one is "given data draw the empirical distribution, print it out and make marks on certain spots, then draw a confidence interval around those spots" is this one. This can be supplemented with using technology to find the intervals automatically.
6. Whereas the teaching of z-scores and t-scores encourages students to use those tests without justification, the teaching of non-parametric statistics in this manner will encourage students to think about empirical distribution and what statistics are important first, which will give them access to a larger toolkit. In a second course on statistics, it can be further pointed out for the statistics of greatest interest certain distributional forms can be expected, meaning z-scores and t-scores can come back into the curriculum, this time in the proper place.

Alternately, we can tell people that good science is whatever weird randomness you can get in a lab, testing be damned. After all, some prefer theft to honest toil...